The core facility metabolomics has a close collaboration with the Bioinformatics Laboratory headed by Prof. dr. Antoine van Kampen located at the Amsterdam UMC; location AMC. This collaboration helps us developing professional tools for the analysis of our complex metabolomics/fluxomics and lipidomics data. Our bioinformaticians developed in-house annotation software tools in the programming languages R and MATLAB for the proper annotation of complex lipid species (figure 1).
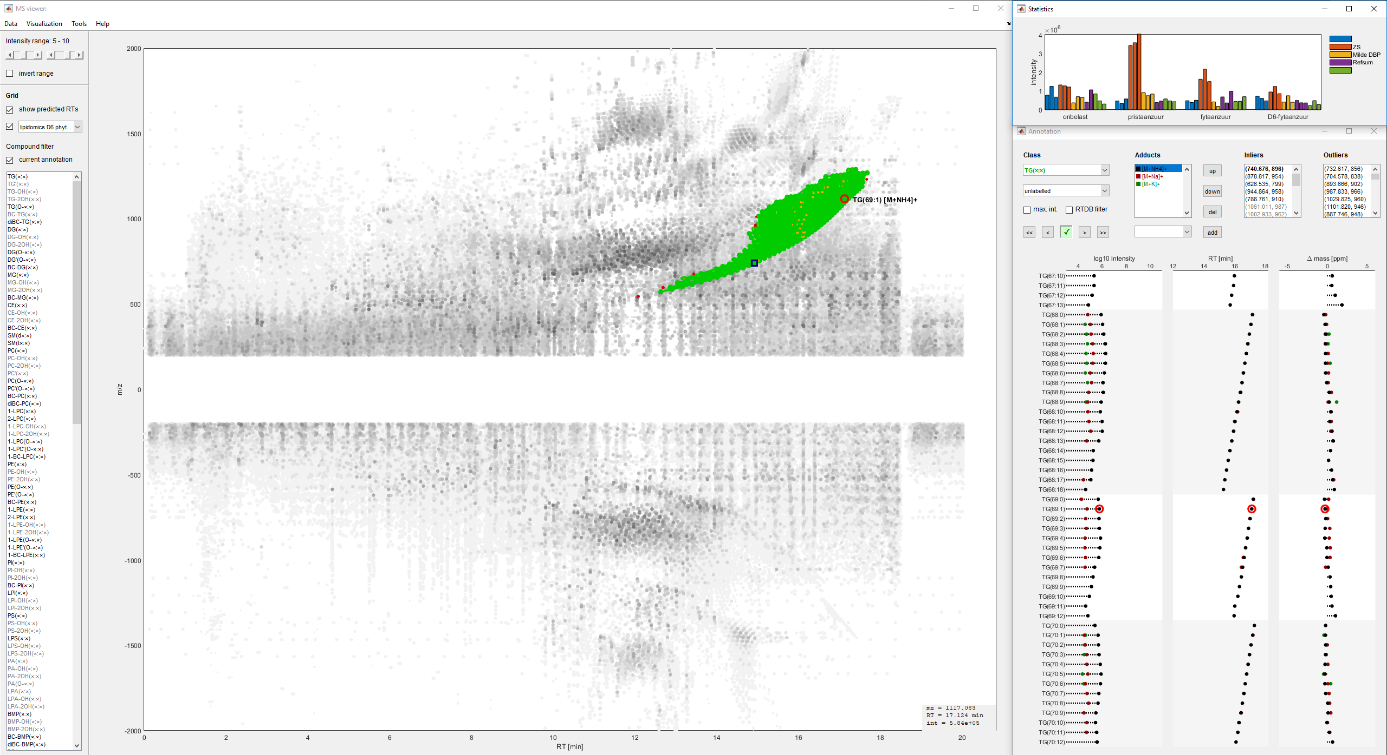
Figure 1. The inhouse built MATLAB pipeline for the annotation of lipid species.
In addition to our annotation pipeline we also developed tools for in-depth statistical analysis, visualization tools for the data, pathway analysis and automatic reporting for understanding of the data (figure 2). Using R packages including IsoCorrectoR and multiple in-house made R packages we perform metabolic flux analysis and this produces reliable data and visualizations that allow understanding and interpretation of the metabolome.
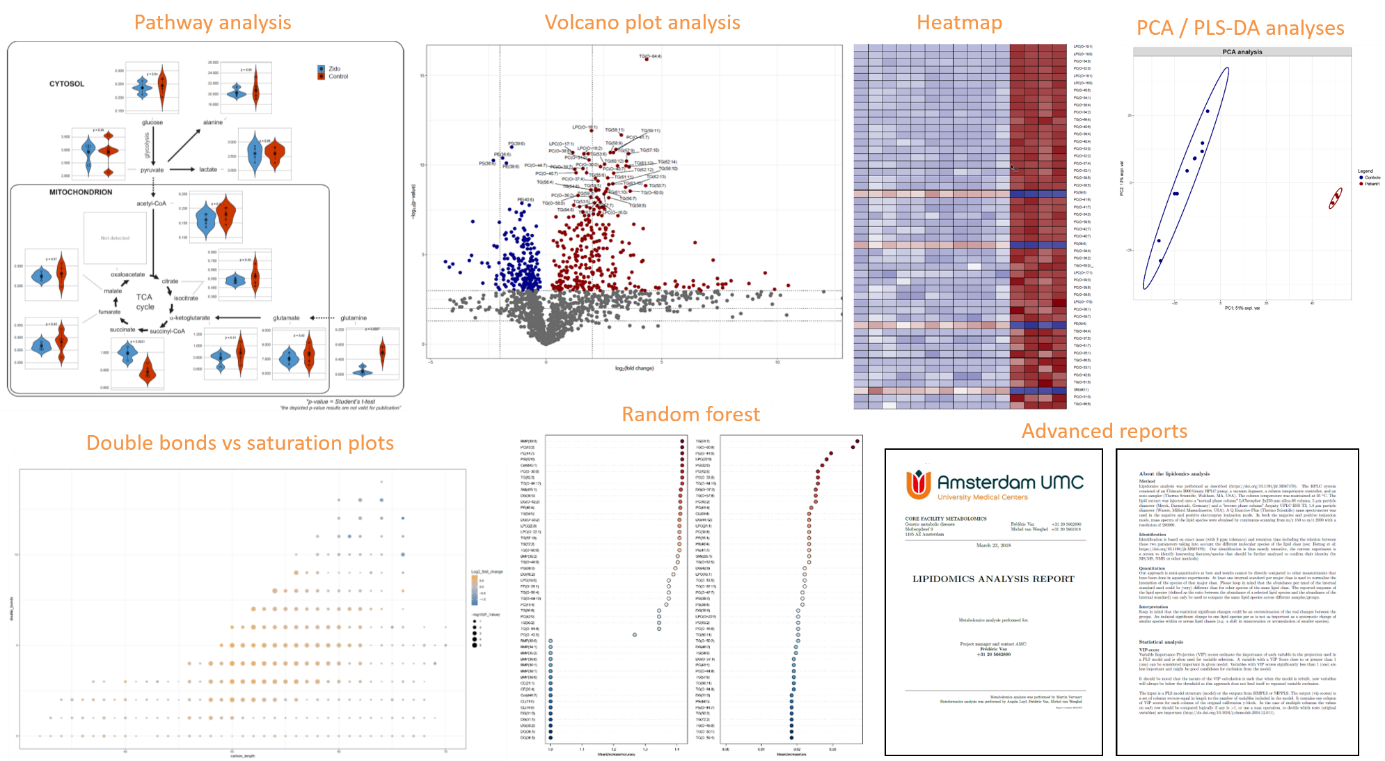
Figure 2. Output of the metabolomics/lipidomics statistical analysis and reporting.
We summarize the results in a short report containing most important findings but also provide you with a quality control report in which we give information about the quality of the data. For most data sets we do a parallel analysis of pool/batch controls that allow us to calculate the variation per metabolite (CV%) which helps with the interpretation of your data.