Lipidomics is the comprehensive analysis of all lipids in a sample. In practice, this is challenging given the very diverse properties of lipids. To maximise the coverage of the lipidome, our lipidomics platform analyses one sample 4 times on two different analytical columns (Figure 1).
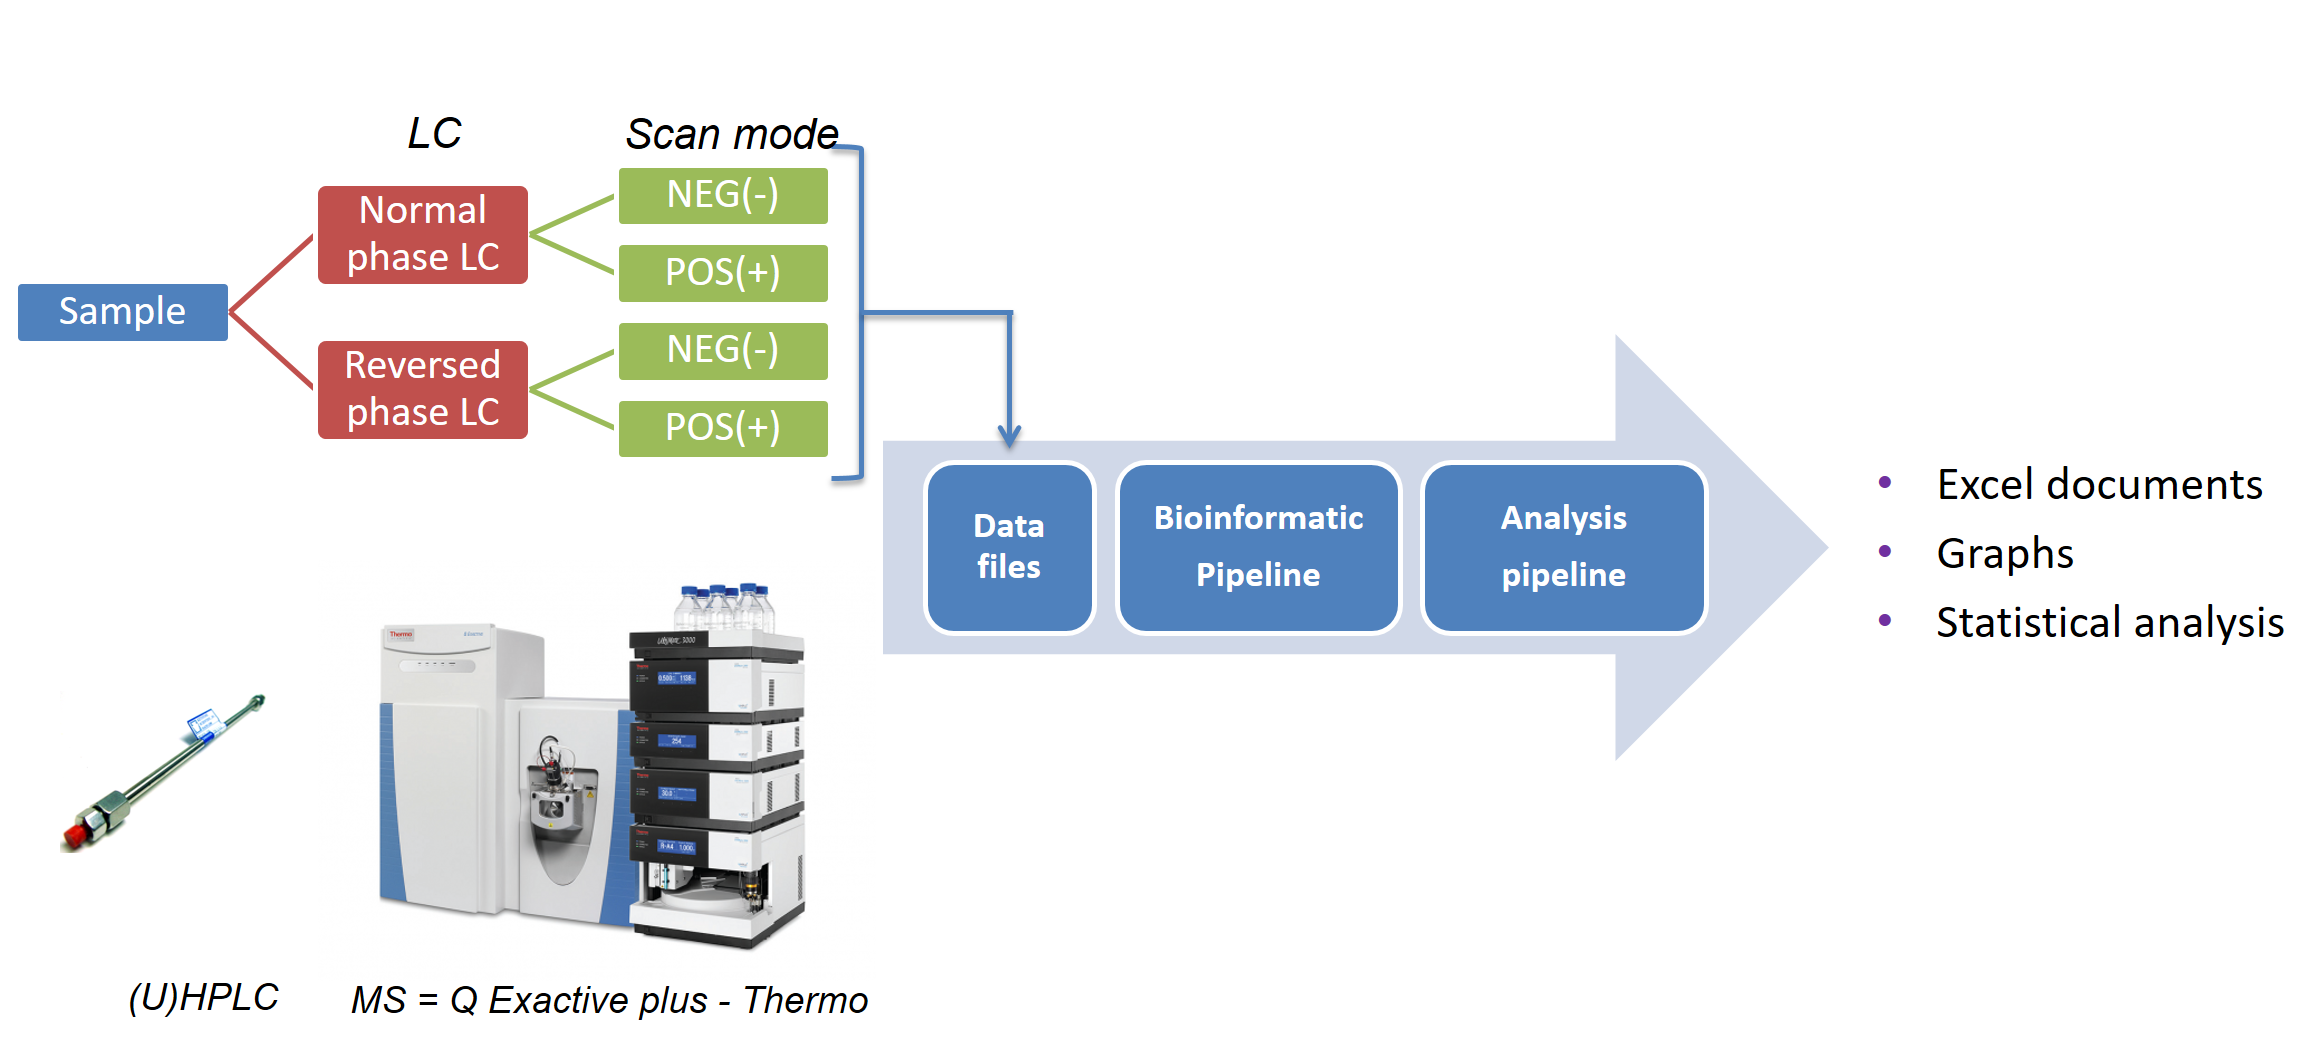
Figure 1. Overview of the lipidomics platform.
This results in about 4 x 40.000 = 160.000 features that need to be processed by our bioinformatics pipeline to obtain a peaklist. We have built our own program to process these 4 data files and facilitate the complex process of annotation, that is identifying the lipid species in this cloud of features (Figure 2).
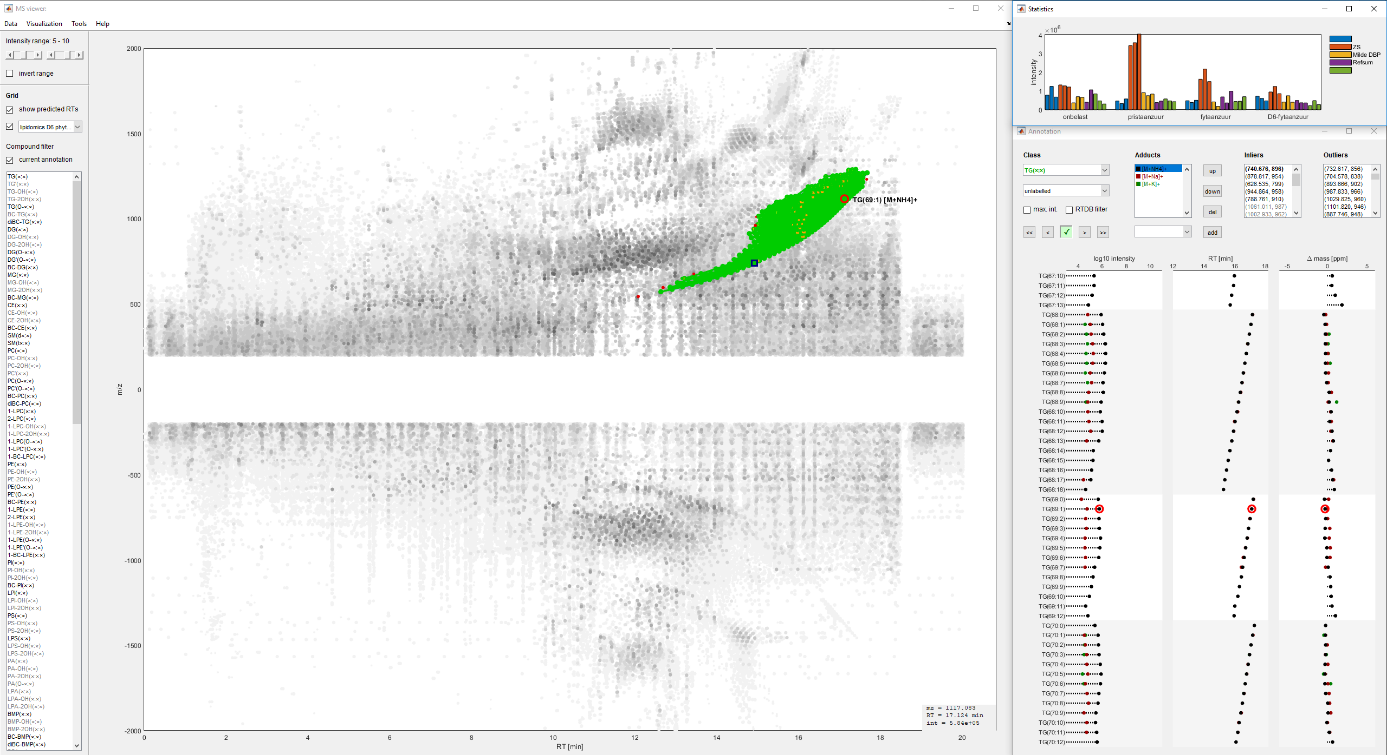
Figure 2. The inhouse built MATLAB pipeline for annotation of lipid species.
For cellular systems we generally provide >2500 annotated lipid species. These are lipids of which representative species have been confirmed by tandem MS analysis and their response is generally calculated on an internal standard. These are the lipid species of which we are most confident of their annotation/identification. This annotated peaklist is then processed through our statistics pipeline that generates different excel and pdf (for figures!) files to better interface with the data. In addition to this we also provisionally annotate (sometimes in an automated way) lipid species and report them together with the unannotated features (so only m/z and retention time) to allow the researcher to receive everything we have measured. We are actively working on also filtering this data so that we can present the most relevant features in this untargeted part of the data.